The OBL Reckoning
The Market Grew Without Growing
Between 2019 and 2023, the rate of peripheral vascular procedures received by Medicare Part B beneficiaries fell 10%. Total Part B payments fell 33%.
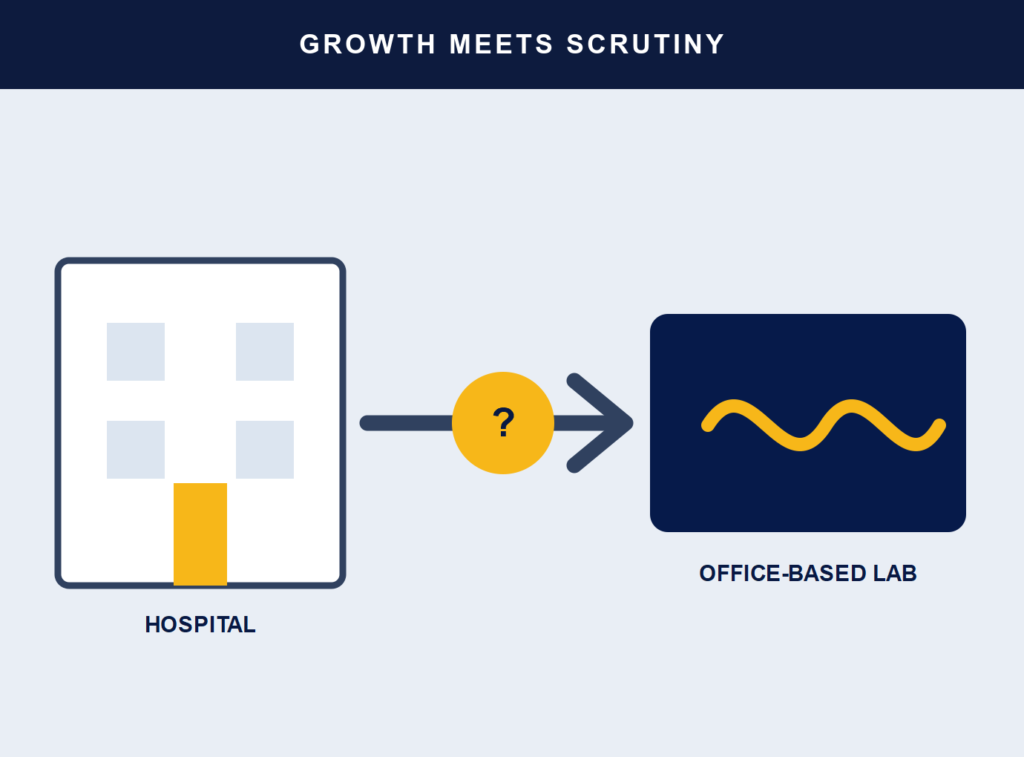
Yet the site of care changed materially. The proportion of procedures performed in OBLs rose from 37.8% to 46.5%, while the hospital outpatient share fell from 35.1% to 27.6%.
This is not a story of indiscriminate market expansion. It is a story of care being redistributed into physician offices.
That migration has understandable appeal. OBLs can offer easier scheduling, focused teams, physician control and a more convenient experience for appropriately selected patients. They also combine the professional and facility components of payment into the physician office rate, unlike hospitals and ASCs where facility costs are paid separately.
The 2026 Review Changed the Conversation
In May 2026, the HHS Office of Inspector General published a national analysis of Medicare fee-for-service claims for lower-extremity angioplasty, stenting and atherectomy performed between 2019 and 2023.
The review did not determine that identified physicians committed fraud or that every flagged procedure was medically unnecessary. It used four claims-based measures to identify billing patterns that differed sharply from peers and could warrant further review.
What the OIG Found in 2023
The 139 physicians represented 7% of 2,069 OBL physicians included in the analysis. Twenty-six physicians—about 1%—accounted for $64 million of the $105 million in concerning payments.
Four Patterns Drew Attention
OIG flagged physicians who billed a tibial procedure for at least 95% of their Medicare patients.
Flagged physicians averaged 5.7 procedures per beneficiary, compared with 2.3 among other physicians.
For one flagged group, 84% of sessions included atherectomy in both femoral and tibial arteries, versus 27% among peers.
OIG examined physicians whose patients were overwhelmingly coded with early-stage disease rather than limb-threatening ischemia.
The concentration matters more than the headline percentage. Most physicians did not meet any of the four measures, while a very small group accounted for most of the flagged spending.
That is also why physician-level context matters. A national site-of-care trend can conceal enormous variation among individual physicians and OBLs.
Why Atherectomy and Tibial Intervention Matter
The 2024 multisociety PAD guideline makes an important distinction between chronic limb-threatening ischemia and less advanced claudication.
Revascularization is recommended to prevent limb loss in patients with chronic limb-threatening ischemia. For claudication, it is generally reserved for patients whose functional limitation persists despite guideline-directed medical therapy and structured exercise. When a patient responds adequately to those measures, revascularization is not recommended.
The evidence is also less certain for isolated infrapopliteal disease in claudication. That makes unusually frequent tibial intervention—and routine use of atherectomy—especially visible to claims-based oversight.
Across vascular surgery, interventional cardiology and interventional radiology, the relevant question is not whether these procedures belong in OBLs. It is whether the indication, anatomy, treatment sequence and expected patient benefit support each intervention.
The Specialty Societies Pushed Back
OIG’s Position
The claims patterns justify closer monitoring because payment incentives, controversial procedure use and extreme physician-level outliers may expose patients and Medicare to unnecessary intervention.
The Societies’ Position
Five vascular and interventional societies agreed on the need for appropriate, evidence-based PAD care but argued that parts of the report’s methodology and clinical framing require more careful interpretation.
The societies noted that claims data cannot fully capture disease severity, anatomical complexity, failed conservative therapy or the clinical reasoning behind a procedure. That is a legitimate limitation.
But the OIG did not claim to have completed medical-necessity determinations. It identified outlier patterns and asked CMS to investigate them. CMS agreed to monitor billing and follow up with the physicians identified.
What Changes Next
Procedure mix, arterial region, repeat interventions and disease-stage coding can all be compared with peer patterns.
Symptoms, imaging, prior medical therapy, structured exercise and the rationale for intervention will matter beyond the individual chart.
Centers with disciplined selection and balanced treatment patterns may become easier to distinguish from extreme-volume outliers.
ClearSight’s site-of-care view reflects the same underlying reality: OBL activity cannot be understood through facility counts alone. It must be connected to the physicians performing the procedures, their specialties, their procedure mix and the other sites where they practice.
That context is particularly important when an OBL’s volume is driven by a small number of physicians or concentrated in procedures attracting regulatory attention.
The OBL Is Entering Its Accountability Phase
Office-based vascular care is not retreating. Even as overall peripheral vascular utilization declined, OBLs captured a larger share of the market.
The challenge is that the sector’s strengths—physician autonomy, focused operations and a favorable payment structure—can also create conditions for unusually aggressive utilization.
The next phase of OBL growth will depend on whether the model can demonstrate not only convenience and efficiency, but consistent alignment with clinical evidence.
- HHS Office of Inspector General. Utilization Trends and Medicare Part B Billing for Office-Based Peripheral Vascular Procedures Raise Questions About Program Integrity. OEI-01-24-00250, May 2026.
- Gornik HL, et al. 2024 ACC/AHA/Multisociety Guideline for the Management of Lower Extremity Peripheral Artery Disease. Journal of the American College of Cardiology. 2024.
- SCAI, Association of Black Cardiologists, Society of Interventional Radiology, Society for Vascular Surgery and Outpatient Endovascular and Interventional Society. Joint Statement on HHS-OIG Report OEI-01-24-00250, June 2026.
- U.S. Department of Justice. Vascular Practice and Physician Agree to Pay More Than $6.73 Million to Resolve False Claims Act Allegations, May 2026.
- ClearSight Health Commercial Intelligence Platform. Physician, facility, procedure and site-of-care profiles, accessed July 2026.
Methodology: National utilization and payment figures come from the HHS-OIG analysis of Medicare fee-for-service Part B claims for CPT 37220–37235 from 2019 through 2023. OIG’s four measures identify billing patterns that may warrant scrutiny; they are not medical-record reviews or findings of fraud. Clinical context comes from the 2024 multisociety PAD guideline and the cited specialty-society response. ClearSight references provide physician, specialty and site-of-care context but are not the source of the national OIG estimates.